• HOME
  • COMMITTEES
  • sponsors
  • SUBMISSIONS
  • INSTRUCTIONS
  • PROGRAM
  • poster
  • DEMOS_BOF
  • REGISTRATION
  • ACCOMMODATION
  • SOCIAL EVENTS
  • LOCAL INFORMATION

PROGRAM

Schedule Outline

*Daily Schedule
| Sun, Oct 4 | Mon, Oct 5| Tue. Oct 6 | Wed, Oct 7| Thu, Oct 8|

time-schedule.gif


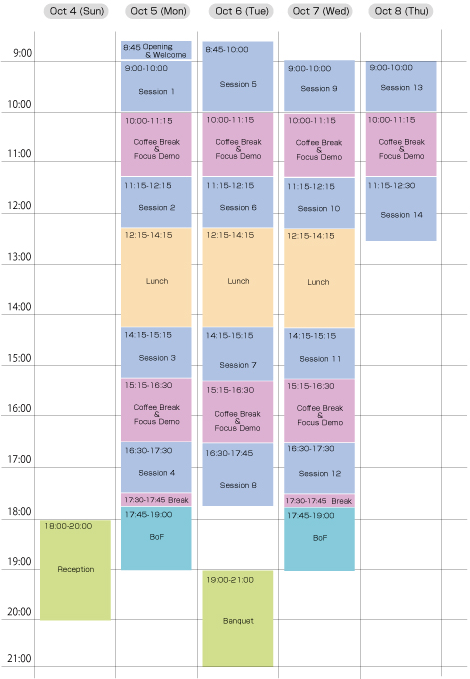
 Sunday, October 4, 2009
18:00-20:00   Welcome Reception

 Monday, October 5, 2009
8:45-9:00   Opening & Welcome
9:00-10:00 Session 1 Archive architectures - 1 Pedro Osuna
ESA New Generation Archives: Application of state of the art re-engineering to SOHO and EXOSAT Science Archives PDF
Rick Ebert
20 Years of Software Reuse and Data Curation in the NASA/IPAC Extragalactic Database
10:00-11:15   Coffee Break & Focus Demo
11:15-12:15 Session 2 Archive architectures - 2 Xiuquin Wu
Spitzer Heritage Archive PDF
Trey Roby
Archive Web sites using AJAX & GWT PDF
12:15-14:15   Lunch
14:15-15:15 Session 3 "Most dangerous" Practices/Large Systems - 1 Nuria Lorente
The Science Data Model for ALMA and EVLA: The Triumphs and Pitfalls of Software Sharing and Reuse PDF
Brian Glendenning
Status of ALMA Software PDF
Takeshi Nakazato
Current Status of Single-Dish Data Analysis Software for ALMA PDF
Wei-Hao Wang
SIMPLE Imaging and Mosaicking PipeLinE PDF
15:15-16:30   Coffee Break
16:30-17:30 Session 4 Large Systems - 2 James Lewis
Pipeline Processing for VISTA
Juan Vallejo
Flexible operations planning data repository for space science missions PDF
Yoshiyuki Yamada
Design of Astrometric Mission(JASMINE) by applying Model Driven System Engineering
Joseph Pollizzi
The Science and Operations Center for the James Webb Space Telescope PDF
17:30-17:45   Break
17:45-19:00    BoF

 Tuesday, October 6, 2009
8:45-10:00 Session 5 Time Domain, Transients, Planets -1 Pavlos Protopapas
The Time Series Center: A next generation search engine using semantics, machine learning, and GPGPU
Arnold Rots
When Time Is of the Essence PDF
Rob Seaman
Transient Response Astronomy: How & Why PDF
Ashish Mahabal
Mixing Bayesian Techniques for Effective Real-time Classification of Astronomical Transients PDF
10:00-11:15   Coffee Break & Focus Demo
11:15-12:15 Session 6 Time Domain, Transients, Planets - 2 Bruce Berriman
The NASA Exoplanet Science Institute Archives: KOA and NStED PDF
David Ciardi
An Overview of the Kepler Science Analysis System
Roy Williams
The US-VAO Facility for Rapid Transients
12:15-14:15   Lunch
14:15-15:30 Session 7 Time Domain, Transients, Planets - 3 / Solar Physics Carl Grillmair
The Palomar Transient Factory Pipeline and Archive PDF
Hitoshi Negoro
Real-time X-ray transient monitor and alert system of MAXI on the ISSPDF
David McKenzie
Cycles of Activity: Acquiring, Preparing, and Exploiting X-ray Images of the Solar Corona
15:30-16:30   Coffee Break
16:30-17:30 Session 8 Large Systems - 3 Daniele Gardiol
BAM/DASS: data analysis software for sub-microarcsecond astrometry devicePDF
William O'Mullane
Java and High performance computing in Gaia processing PDF
Stephan Ott
The Herschel Data Processing System "HIPE and pipelines" up and running since the start of the mission PDF
Nicolas Morisset
Critical Design Decisions of The Planck LFI Level 1 Software PDF
19:00-21:00   Banquet

 Wednesday, October 7, 2009
9:00-10:00 Session 9 Hardware Architecture / Algorithms Yoshihiro Chikada
AD Conversion Revisited in the Frequency Domain PDF
Ninan Philip
Photometric determination of quasar candidates PDF
Taihei Yano
Centroiding experiment for determining the positions of stars with high precision PDF
10:00-11:15   Coffee Break
11:15-12:15 Session 10 Web 2.0, New Software Technology Paul Marganian
Web 2.0 and Other New Software Techniques for Astronomy PDF
Michael Kurtz
Using Multipatite Graphs for Recommendation and Discovery PDF
Sebastien Derriere
'SAMP'ling your browser for the Semantic Web PDF
12:15-14:15   Lunch
14:15-15:15 Session 11 Visual Applications - 1 Ajit Kembhavi
Data Visualisation, Statistics and Machine Learning PDF
Pierre Fernique
Another way to explore the sky: HEALPix usage in Aladin full sky mode PDF
Christopher Fluke
Visualization-directed interactive model fitting to spectal data cubes PDF
15:15-16:30   Coffee Break
16:30-17:30 Session 12 Visual Applications - 2 Matthew Schneps
Different Displays for Different Brains: How Neurology of Vision Effects Data Interpretation PDF
Vladimir Gorohov
Cognitive imaging in visual data-driven decision-support systems PDF
Jonathan Fay
WorldWide Telescope: A system of components enabling institutions to create rich web based data access and visualization tools
17:30-17:45   Break
17:45-19:00    BoF

 Thursday, October 8, 2009
9:00-10:00 Session 13 Virtual Observatory - 1 Bob Hanisch
The Virtual Observatory: Retrospective and Prospectus PDF
VAMDC: The Virtual Atomic and Molecular Data Centre
Chenzhou CUI
A VO-driven National Astronomical Data Grid in China PDF
Igor Chilingarian
Transparent scientific usage as the key to success of the VO
10:00-11:15   Coffee Break
11:15-12:15 Session 14 Virtual Observatory - 2 / Development Tools & Environments Masatoshi Ohishi
Lessons Learned during the Development and Operation of Virtual ObservatoryPDF
Franck Le Petit
Theoretical Virtual Observatory services at VO-Paris Datacentre
Alain Coulais
Status of GDL - GNU Data Language PDF
12:15-12:30   Closing Remark

ORAL

ESA New Generation Archives: Application of state of the art re-engineering to SOHO Science Archive and EXOSAT Science Archive
Pedro Osuna European Space Agency
The Science Archives and VO Team (SAT), part of the Science Operations Department of the European Space Agency, started building Astronomical Data Archives back in 1996. IT standards, tools, languages, etc. have had an evolution which could hardly be foreseen at the time. After more than ten years of the first public version of the Infrared Space Observatory (ISO) Archive, the SAT has undertaken the effort to build a state of the art ″Archives Building System Infrastructure″ that provides the building blocks for creation of ESA Space Based Missions archives with renewed technologies and standards. As a demonstration of the goodness of the approach, two Science Archives, coming from two very different research fields, have been created from scratch using the new technology: the SOHO Science Archive and the EXOSAT Science Archive, both made public to the community last April. In this talk, the overall ″Archives Building System Infrastructure″ concept will be shown, and summary of its applicatioin to the building of the ESA New Generation Archives SSA and EXSA will be presented.
|top|


20 Years of Software Reuse and Data Curation in the NASA/IPAC Extragalactic Database
Rick Ebert California Institute of Technology, NED
The NASA/IPAC Extragalactic Database (NED) is approaching its twentieth anniversary of service to the astronomy community and the public. NED is currently the largest online compilation of information on extragalactic objects. NED is a key participant in the United States Virtual Astronomical Observatory (VAO) and an integrated information provider to GoogleEarth (″sky mode″), the Microsoft Research World-Wide Telescope, and numerous U.S. and international space- and ground-based observatories and research projects. Information from catalogs, archives, images, spectra, and the scientific literature are distilled and associated by the NED Team and a global community of astronomers into a uniform knowledge-base of over 163 million celestial objects. We present a short retrospective on NEDs 20-year evolution; a quick tour of the information holdings; the technologies and software currently used to support the service; and a glimpse of the future of NED. NED is a service of the California Institute of Technology/Infrared Processing and Analysis Center, provided to the scientific community and the public under contract to the U.S. National Aeronautics and Space Administration.
|top|


Spitzer Heritage Archive
Xiuqin Wu IRSA/SSC, Caltech,
[This is the abstract for the invited talk: Spitzer Heritage Archive] The Spitzer Heritage Archive will host all the raw and final reprocessed science and calibration data products from the observations made by Spitzer Space Telescope, which is the fourth and final element in NASA′s family of Great Observatories. Spitzer was launched in August 2003. It observed in the 3.6 to 160 micron range with three instruments: IRAC, IRS, and MIPS for five and half years. The cryogen was depleted in May 2009 and it is now in its extended warm mission, observing in 3.6 and 4.5 microns using IRAC. The Spitzer observations have produced vast amount of imaging and spectroscopy data. The heritage archive will make this treasure trove available for astronomy community. The requirements and expectations from our users led us looking into the new technologies in the web interface development. We believe that a good user interface will enhance the user experience to explore the Spitzer data, thus increase the potential of science discovery. We decided on using Google Web Toolkit to deliver an AJAX based web interface, which is powerful and easy-to-use. It will give users the tools to search the database, explore their search results interactively. The meta data will be presented in an easy to read table format. Users can page through their data results, perform sorting, filtering on any column. They can also view the FITS images and spectrum plots before they decide to download them. We also try to reuse the existing software and services, pay close attention to the re-usability of the newly developed system, make it easy to expand, to adopt new technology in the future. This talk will discuss our design principles, system architecture, reuse of the existing software, and reusable components of the system.
|top|


Archive Web sites using AJAX & GWT
Trey Roby Caltech / IPAC
[Note to administator - This abstract is for an invited talk. Under the catagory: ″Archive applications using visualization: focusing on UIs ALONE″ I accepted the invitation but I have not seen any other way to submit the abstract] -------------------- Begin Abstract ----------------------------------- The last three years have seen much change in web technology and have created some significant breakthroughs. We are now able to let the user interact with an archive from the Web browser in ways we have never thought possible. The Web browser is no longer a glorified batch processing terminal, but an interactive environment that allows the user to have a similar experience as one might expect with an installed desktop application. We can now provide web based FITs viewing and interaction without any plugins. Much of this is made possible using AJAX. AJAX technology has made an major impact on how we think about developing on the Web. Users expect more and are drawn to more interactive and intuitive web sites. The problem with the Javascript part of AJAX is that it does not scale well to large Web applications, is hard to debug, and a lot of browser specific code is required. Google Web Toolkit (GWT) provides the solution to this problem. With GWT, you write code in Java that is compiled into Javascript. GWT handles many of the browser-specific issues and provides you an environment to develop very powerful web sites. This talk will discuss the concepts behind AJAX and GWT. We will also show how using these technologies in an archive web site will create a truly interactive experience.
|top|


The Science Data Model for ALMA and EVLA: The Triumphs and Pitfalls of Software Sharing and Reuse
Nuria P. F. Lorente NRAO
Software sharing and reuse are generally hailed as good practice, both at the programming level and as a high-level design consideration. In practice, however, the amount of software reuse within the astronomical community falls below potential levels. Two reasons commonly cited as barriers to software sharing are: first, the small size of the astronomical community means that projects with similar software needs do not overlap in time. Second, are the difficulties faced in obtaining political support for software reuse endeavours, which entail an extra cost to the institution for potential long-term benefits to the wider community. The ALMA and EVLA telescope projects, due to their unique positions of overlap - both temporal and in institutional involvement - have avoided these obstacles and have taken the opportunity to develop a common Science Data Model. This paper will present the work done by the ALMA and EVLA software teams towards creating and using a common Science Data Model, and will discuss the advantages and disadvantages of code sharing and reuse, as experienced by these two telescope projects.
|top|


Status of ALMA Software
Brian Glendenning NRAO
The authors are responsible for the software for the Atacama Large Millimeter/Submillimeter Array (ALMA), currently under construction at a high site (5000m) in northern Chile. The software is being developed by a large team of more than 70 people on 4 continents, and has been under development for about 10 years. The project has entered its commissioning phase, and the first call for proposals for early science observations will occur in late 2010. In this paper we will outline the current status of the ALMA software. We include both the technical state of development as well as the process and management approaches used.
|top|


Current Status of Single-Dish Data Analysis Software for ALMA
Takeshi Nakazato National Astronomical Observatory of Japan, ALMA Project Office
We will summarize a current status and a future development plan of the single-dish analysis capability of CASA (Common Astronomical Software Applications). The CASA is a data analysis package for the next generation radio astronomical telescopes such as ALMA (Atacama Large Millimeter/sub-millimeter Array). Since ALMA is a heterogeneous radio telescope array that consists of an extended interferometric array with fifty 12-m antennas, a compact interferometric array with twelve 7-m antennas, and four single-dish 12-m antennas, CASA must support an analysis of both interferometric and single-dish data. The single-dish analysis part of CASA is being developed mainly by Japanese contribution based on an external software package ASAP (ATNF Spectral Analysis Package). CASA can perform a calibration, a baseline fitting, a flagging, an averaging, and a smoothing of spectral data using ASAP functionalities. In addition, CASA is capable of an imaging of single-dish data. CASA and ASAP consist of C++ ″engines″, which are a set of libraries for data analysis written in C++, and user interfaces written in Python. The C++ engines can be accessed from Python through interfaces that are implemented using CCM Tools (CASA) and Boost (ASAP). Notable feature of CASA is two types of user interface called a ″task″ and a ″tool″. The tool is direct interface to C++ engine classes and enables expert users to perform a flexible data processing. On the other hand, the task is constructed using several tools and provides handier interface that can be used by both expert and non-expert users. Our goal is to support all single-dish observing modes that will be implemented as standards of ALMA. These modes include various types of switching methods (position-switch via an antenna movement or a nutation of a sub-reflector, frequency-switch) and a combination of those with On-The-Fly (OTF) technique. In the current release, CASA is able to deal with the data obtained by classical switching methods, although some functionalities are still under development. Improvement of currently available functions and a support of an analysis of the OTF data will be implemented in the next release that is planned at the end of 2009.
|top|


SIMPLE Imaging and Mosaicking PipeLinE
Wei-Hao Wang Academia Sinica Institute of Astronomy and Astrophysics
The SIMPLE Imaging and Mosaicking PipeLinE (SIMPLE) is an IDL based data reduction environment designed for processing optical and near-IR data obtained from wide-field mosaic cameras. It has standard functions for flat fielding, sky subtraction, distortion correction, and photometric and astrometric calibrations. One of the key features of SIMPLE is the ability to correct for image distortion from a set of dithered exposures, without relying on any external information (e.g., distortion function of the optics, or an external astrometric catalog). This is achieved by deriving the first-order derivatives of the distortion function directly out of the dithered images. This greatly help to produce high accuracy on astrometry as well as preserve image sharpness in the mosaicked/stacked image. Despite being designed toward a general reduction environment, the current distribution of SIMPLE has two highly optimized packages, one for the Wide-field InfraRed Camera on the Canada-France-Hawaii Telescope and the other for the Multi-Object InfraRed Camera and Spectrograph on the Subaru Telescope. SIMPLE has produced excellent (photometrically and astrometrically) wide-field images from both cameras. Users and the author of SIMPLE are also developing optimized SIMPLE pipelines for other mosaic cameras such as the Subaru Prime Focus Camera.
|top|


Pipeline Processing for VISTA
James Robert Lewis Institute of Astronomy, University of Cambridge
The VISTA telescope is a 4 metre instrument which has recently been commissioned at Paranal, Chile. Equipped with an infrared camera, 16 2Kx2K Raytheon detectors and a 1.7 square degree field of view, VISTA represents a huge leap in infrared survey capability in the southern hemisphere. Pipeline processing of IR data is far more technically challenging than for optical data. IR detectors are inherently more unstable, while the sky emission is over 100 times brighter than most objects of interest, and varies in a complex spatial and temporal manner. To compensate for this, exposure times are kept short, leading to high nightly data rates. VISTA is expected to generate an average of 250 GB of data per night over the next 5-10 years, which far exceeds the current total data rate of all 8m-class telescopes. In this presentation we discuss the pipelines that have been developed to deal with IR imaging data from VISTA and discuss the primary issues involved in an end-to-end system capable of: robustly removing instrument and night sky signatures; monitoring data quality and system integrity; providing astrometric and photometric calibration; and generating photon noise-limited images and science-ready astronomical catalogues. Some preliminary science results will be shown.
|top|


Flexible operations planning data repository for space science missions
Juan C. Vallejo GMV/ESAC
The number and complexity of space science missions continues to increase. The only way this growth can be maintained is to increase the cost effectiveness, as well as the performance, of operations. The biggest challenge in achieving this objective is to accommodate the technical, scientific and operation policy variability across and within missions. Such variability, by its very nature, prevents the development of one-fit-for all operation systems and leads to systems with high levels of adaptability. To date a bottom- up approach has been traditionally used to develop one mission from another. However, in order to be able to meet the above challenges, a top-down approach is the only approach which will allow the efficient development of such systems. The development of the Planning Repository (P-REP) follows this approach. It is being carried out, under ESA contract, by a consortium made of Grupo Mecanica de Vuelo (GMV) and of the Rutherford Appleton Laboratory (STFC/RAL). The purpose of the project is to specify, design and develop a prototype for a centralized information repository to store any relevant operation planning data for any past, current or future mission. Typical planning information that can be stored includes the predicted or measured events, constraints and/or rules, plans as well as any information that can help users to generate the latter. More specifically this type of information can be the result of the processing of downlinked data and contain, for example, Quick Look Analysis information and feedback of the science results from the PI teams. The data to be handled by the P-REP can be files, file content or any type of relevant planning information. To ensure its fast adaptability to new mission planning requirements, the P-REP is more than just a basic database. It provides a user environment that facilitates, in a secure and role-driven system, not only the access to the database content but also the adaptability of its external interfaces and of the user defined, mission specific data storage modeling. In addition, the architecture of the prototype itself is such that the P-REP core functionalities can be extended in the future with the potential to become a powerful complement to automated or manual planners. We will present the main ideas driving the project and its current status. We will also present how this project is positioned in a global effort for building generic science operation center frameworks (including data repositories, scheduling and planning systems and control centers, among others). We will show why this P-REP can be used not only for planetary missions, its original prime target, but also for any types of mission including observatory type missions. In conclusion, we believe the P-REP development is a key step towards this ambitious solution to the generic problem of performance and productivity increase.
|top|


Design of Astrometric Mission(JASMINE) by applying Model Driven System Engineering
Yoshiyuki Yamada Kyoto University, Department of Physics
We are planning space astrometric satellite mission named JASMINE. The mission aims to measure positions, proper motions, and parallaxes of 10,000 stars in the several square degrees area within the galactic bulge. Comparing other astronomical mission, the weight of data analysis is larger in astrometry. Collecting all data during the mission, estimate astrometric parameter by applying observation equations with least square fit. Stellar motion on the celestial sphere contains periodic motion with one year frequency. But it is impossible that the instrument is made to be stable in one year time scale. The target accuracy of parallaxes in JASMINE observation is 10 micro arcsecond, which corresponds to 1 nm scale on the focal plane. It is very hard to measure the 1 nm scale deformation of focal plane. Eventually, we need to add the deformation to the observation equations when estimating stellar astrometric parameters. In this situation, as the observation equations become more complex, we may reduce the stability of the hardware, nevertheless, we require the larger number of samplings due to the lack of rigidity of each estimation. That means this mission imposes a number of trade-offs in the engineering choices and then decide the optimal design from a vast of candidates. In order to efficiently illustrate and support such decisions through the development, we apply Model Driven Systems Engineering (MDSE) to JASMINE project. In this project, MDSE improves the efficiency of the engineering by revealing and formalizing requirements coming from various stake holders, such as Astronomical Scientists, Heat Control Engineers, and Data Analyst, by using constraints (called Feature Model). It improves the efficiency to adjust the conflicts of requirements of many viewpoints since the stake holders may understand various concerns through the formalized constraints and then IT system can mediate efficient collaboration by articulating what constraints are obstacles to satisfy the target and who are responsible for solving those concerns. In this talk, we reports the effects of application MDSE to JASMNIE project and its results.
|top|


The Science and Operations Center for the James Webb Space Telescope
Joseph Anthony Pollizzi Space Telescope Science Institute
The James Webb Space Telescope (JWST) is widely touted as the successor to the venerable Hubble Space Telescope. To be launched in the summer of 2014, JWST will be one of the largest and most sophisticated satellites ever built for scientific exploration. The Space Telescope Science Institute (STScI) has the contract with NASA to design, develop and operate the JWST Science and Operations Center. For HST, a number of separate contractors built the equivalent center that the STScI then operated. Over time, STScI has integrated, maintained, and upgraded the HST SOC to successfully support the HST. Now, the STScI has the opportunity to leverage that twenty year experience of the lessons learned from operating the HST and evolving its systems to build the SOC for JWST from the ground up. This paper presents the architecture being planned, the lessons learned that are being applied and some of the challenges to be overcome in constructing the JWST SOC.
|top|


The Time Series Center: A next generation search engine using semantics, machine learning, and GPGPU
Pavlos Protopapas CfA
The Time Series Center is an interdisciplinary effort dedicated to creating the world′s largest database for astronomical and other time series and developing algorithms to understand various aspects of those time series. The partnership of the data center and the analysis effort makes discoveries of new and rare variability phenomena, and large scale studies of known phenomena possible. We describe in this talk the data resident now in the database and the plan for the near future, the architecture behind the data center and a highly interactive web based search and visualization application. We finally report on an automatic classification for stellar objects using machine learning techniques and semantic queries. We present the science results already obtained using the resources of the data center.
|top|


When Time Is of the Essence
Arnold H Rots Smithsonian Astrophysical Observatory
When dealing with (or preserving) time series data, one does well to consider the circumstances under which the data were taken and the uses they may be put to. The higher the timing accuracy that is required, the more stringent will be the requirements for complete and accurate metadata. This paper presents a brief tutorial on time scales, time standards, and time metadata requirements. This includes issues like the difference between dynamic and coordinate time scales, relativistic effects, the connection with spatial coordinate information and barycenter corrections. In this context, we will also review the Virtual Observatory time standards and the proposed FITS Time standard - WCS Paper V. This work is supported by NASA contract NAS8-03060 (CXC).
|top|


Transient Response Astronomy: How & Why
Rob Seaman NOAO
A time domain tsunami threatens observational astronomy. Survey archives of the static sky have the chance to mature for several years before being published. But vast cascades of celestial transient events will be released from the very beginning of grand new projects such as the Large Synoptic Survey, Pan-STARRS and the Dark Energy Survey. Rapid follow-up combined with reliable semantic classification will be required for scientifically productive transient response observing modes. The VOEvent standard of the International Virtual Observatory Alliance is one ingredient for constructing flexible, efficient, autonomous architectures for carrying out experimental design when time is of the essence. We discuss constraints of scheduling, robotic control, observing modes, cadence, instrumentation, and telescope networking that will determine the success or failure of the systematic exploration of the terrain of time.
|top|


Mixing Bayesian Techniques for Effective Real-time Classification of Astronomical Transients
Ashish A Mahabal California Inst. of Technology
With the recent advent of time domain astronomy through various surveys several approaches at classification of transients are being tried. Choosing relatively interesting and rarer transients for follow-up is important since following all transients being detected per night is not possible given the limited resources available. In addition, the classification needs to be carried out using minimal number of observations available in order to catch some of the more interesting objects. We present details on two such classification methods: (1) using Bayesian networks with colors and contextual information, and (2) using Gaussian Process Regression and lightcurves. Both can be carried out in real-time and from a very small number of epochs. In order to improve classification i.e. narrow down number of competing classes, it is important to combine as many different classifiers as possible. We show how this can be incorporated in a higher order fusion network and tied with optimal follow-up.
|top|


The NASA Exoplanet Science Institute Archives: KOA and NStED
Graham Bruce Berriman IPAC, Caltech
The NASA Exoplanet Science Institute (NExScI) maintains a series of archival services in support of NASA′s planet finding and characterization goals. Two of the larger archival services at NExScI are the Keck Observatory Archive (KOA) and the NASA Star and Exoplanet Database (NStED). KOA, a collaboration between the W. M. Keck Observatory and NExScI, serves raw data from the High Resolution Echelle Spectrograph (HIRES) and extracted spectral browse products. As of June 2009, KOA hosts over 28 million files ( 4.7 TB) from over 2,000 nights. In Spring 2010, it will begin to serve data from the Near-Infrared Echelle Spectrograph (NIRSPEC). NStED is a general purpose archive with the aim of providing support for NASA′s planet finding and characterization goals, and stellar astrophysics. There are two principal components of NStED: a database of (currently) all known exoplanets, and images; and an archive dedicated to high precision photometric surveys for transiting exoplanets. NStED is the US portal to the CNES mission CoRoT, the first space mission dedicated to the discovery and characterization of exoplanets. These archives share a common software and hardware architecture with the NASA/IPAC Infrared Science Archive (IRSA). The software architecture consists of standalone utilities that perform generic query and retrieval functions. They are called through program interfaces and plugged together to form applications through a simple executive library.
|top|


An Overview of the Kepler Science Analysis System
David Ciardi NExScI/Caltech
The NASA Exoplanet Science Institute (NExScI) at Caltech has developed the Kepler Science Analysis System (KSAS) for NASA′s exoplanet finding mission Kepler. Kepler was launched in March 2009 and has entered science operations. KSAS was built upon the same architecture used by NExScI′s NASA Star and Exoplanet Database (NStED), which was built upon the extensible Infrared Science Archive (IRSA). KSAS is used by the Kepler project to organize the targets and all data associated with the targets including preparatory data, mission data, follow-up data. KSAS also includes tools to enable target selection, target prioritization, data loading and mission product browsing. After initial development at NExScI, KSAS was packaged, delivered to NASA Ames and installed at Ames where it is currently in use by the Kepler project. KSAS, itself, is designed to be extensible and can be adapted for use by future exoplanet missions that NASA may support. An overview of KSAS is presented, highlighting the design and functions which have been built upon and adapted from the extensible IRSA/NStED architecture.
|top|


The US-VAO Facility for Rapid Transients
Roy D Williams Caltech
This is an overview of how the US-VAO can provide near-real-time notifications of transient astrophysical events, including pre-emptively fetched data from VO archives about possible precursors of that event, sophisticated triggers so customers get precisely what they want, and custom presentation for each type of event. The Facility will define each event stream in the VO Registry for uniform discovery, provide query services for past events, and build connections to automated telescopic follow-up systems. Many event providers are already on board, including NASA Fermi and SWIFT, LOFAR, Catalina Sky Survey, Pi of the Sky, and many others.
|top|


The Palomar Transient Factory Pipeline and Archive
Carl Johann Grillmair Spitzer Science Center, California Institute of Technology
The Palomar Transient Factory will conduct a wide-field, high-cadence optical survey of the northern sky to detect transient, variable, and moving objects. As a member of the PTF collaboration, the Infrared Processing and Analysis Center is developing an image archive, a high-quality photometry pipeline, and a searchable database of detected sources. The system is capable of processing and storing 300 Gbytes of data per night over the course of the 5-year survey. With an expected total of ~20-40 billion rows, the sources table will be among the largest databases ever created. The survey is efficiently discovering transient sources from asteroids to supernovae, and will inform the development of future sky surveys like the of the Large Synoptic Survey Telescope.
|top|


Real-time X-ray transient monitor and alert system of MAXI on the ISS
Hitoshi Negoro Nihon University, Department of Physics
Maxi, Monitor of All-sky X-ray Image, is launched with the space shuttle Endeavour this summer, and starts X-ray observation from the Japanese Experiment Module ″Kibo″ on the International Space Station, ISS. Two kinds of X-ray cameras have wide fields of view (160 deg x 1.5 deg (FWHM) for Gas Slit Cameras, GSCs, and 90 deg x 1.5 deg for Solid-state Slit Cameras, SSCs), and sensitivity at 2-30 keV and 0.5-10 keV for the GSCs and the SSCs, respectively. The GSCs and SSCs scan about 98 % and 70 % of all-sky every 96 minutes, respectively, and data obtained are downloaded every second through the ISS network. On the ground, we try to find transient objects such as X-ray novae, bursts including Gamma-ray bursts, various flares with Nova Search (X-ray transient monitor) systems, and send alert information to the world if discovered in 30 seconds after X-ray detection. Here we present the introduction of the MAXI Nova Search and alert system we have developed, and real performance in the first quarter year after the launch.
|top|


Cycles of Activity: Acquiring, Preparing, and Exploiting X-ray Images of the Solar Corona
David E McKenzie Montana State University
The relative nearness of the Sun, and its abundance of photons, yield the opportunity to see details on its face, and in its atmosphere. In principle, pointing a suitably designed telescope at the Sun allows measurement of features small enough to be grasped easily in our minds, with sizes measured in tens or hundreds of kilometers. Obviously the task is not so simple. To obtain scientifically useful images we must contend with a host of instrumental difficulties, detector features, and calibration uncertainties. I will briefly demonstrate some of the problems encountered, our attempts to work around them, and the results of our efforts, using data from two solar X-ray telescopes: the Yohkoh Soft X-ray Telescope, and the Hinode X-Ray Telescope. With this information as background, I will show some highlights of recent solar coronal physics, based on the Yohkoh and Hinode images.
|top|


BAM/DASS: data analysis software for sub-microarcsecond astrometry device
Daniele Gardiol INAF - Osservatorio Astronomico di Torino
The INAF - Osservatorio Astronomico di Torino is part of the Data Processing and Analysis Consortium (DPAC) for Gaia, a cornerstone mission of the European Space Agency. Gaia will perform global astrometry by means of two telescopes looking at the sky along two different lines of sight oriented at a fixed angle, also called basic angle. Knowledge of the basic angle fluctuations at the sub-microarcsecond level over periods of the order of the minute is crucial to reach the mission goals. A specific device, the Basic Angle Monitoring, will be dedicated to this purpose. We present here the software system we are developing to analyse the BAM data and recover the basic angle variations. This tool is integrated into the whole DPAC data analysis software.
|top|


Java and High performance computing in Gaia processing.
William J O'Mullane ESA/ESAC
In recent years Java has matured to a stable easy-to-use language with the flexibility of an interpreter (for reflection etc.) but the performance and type checking of a compiled language. When we started using Java for astronomical applications around 1999 they were the first of their kind in Astronomy. Now a great deal of Astronomy software is written in Java as are many Business applications. We discuss the current environment and trends concerning the language and present an actual example of scientific use of Java for high-performance computing: ESA′s mission Gaia. The Gaia scanning satellite will perform a galactic census of about 1000 million objects in our galaxy. The Gaia community has chosen to write its processing software in Java. We explore the manifold reasons for choosing Java for this large science collaboration including recent sucess using the Amazon Cloud for AGIS.
|top|


The Herschel Data Processing System ? HIPE and pipelines ? up and running since the start of the mission
Stephan Ott ESA/ESTEC
The Herschel Space Observatory, the fourth cornerstone mission in the ESA science programme, was successfully launched 14th of May 2009. With a 3.5 m Cassegrain telescope it is the largest space telescope ever launched. Herschel′s three instruments (HIFI, PACS and SPIRE) perform photometry and spectroscopy in the 55 - 672 micron range and will deliver exciting science for the astronomical community during at least three years of routine observations. One month after launch, on its way to L2, the Lagrange point located 1.5 million kilometres away from the Earth, the cryostat lid was opened, and the first observational tests were conducted. Herschel reached its orbit around L2, and is currently beginning its performance verification phase. The development of the Herschel Data Processing System started seven years ago to support the data analysis for Instrument Level Tests. To fulfil the expectations of the astronomical community, additional resources were made available to implement a freely distributable user-friendly Data Processing System capable to interactively and automatically reduce Herschel data at different processing levels. The system combines for the first time data retrieval, pipeline execution and scientific analysis in one single environment. The software is coded in Java and Jython to be platform independent and to avoid the need for commercial licenses. We estimate that currently 250 astronomers are using the system. The Herschel Data Processing System is a joint development by the Herschel Science Ground Segment Consortium, consisting of ESA, the NASA Herschel Science Center, and the HIFI, PACS and SPIRE consortium members. The Herschel Interactive Processing Environment HIPE was designed as the user friendly face of Herschel Data Processing and presented during pre-launch workshops to the Herschel Key Program consortia where also the non-Java versant astronomers welcomed this state of the art interface to process Herschel data. The first PACS preview observation of M51 was processed within HIPE using basic pipeline settings and scripts to a fantastic image within 30 minutes of data reception. Also the first HIFI observations on DR-21 were successfully reduced to high quality spectra, followed by SPIRE observations on M66 and M74. Equally the operational pipelines demonstrated their state of maturity: Using the pre-launch version, all in-flight observations since the start of the mission were successfully processed. This includes the first in-flight observations, SPIRE manual commanding observations, PACS images of M51and HIFI high quality spectra of DR 21. At the time of the conference Herschel should be close to finishing its performance verification phase, and ready for the science demonstration phase when the first observations for Herschel Key Program consortia will be taken. Upon reception, the data are processed, quality controlled in the Herschel Science Centre and ingested into the Herschel Science Archive. We will summarise the current state of the Herschel Data Processing System and give an overview about future development milestones and plans. We will present some Herschel images and spectra to give an exciting foretaste of the science that is to come with Herschel.
|top|


Critical Design Decisions of The Planck LFI Level 1 Software
Nicolas C. Morisset ISDC, Data Centre for Astrophysics
The PLANCK satellite with two on-board instruments, a Low Frequency Instrument (LFI) and a High Frequency Instrument (HFI) has been launched on May 14th with Ariane 5. The ISDC Data Centre for Astrophysics in Versoix, Switzerland, in close collaboration with the Data Processing Centre (DPC) in Trieste, Italy, develops and maintains the Planck LFI Level 1 software for the DPC. The main tasks of the Level 1 processing are to retrieve the daily available raw telemetry data of the LFI instrument, the Sorption Cooler and the 4k Cooler from the Mission Operation Centre (MOC) in Darmstadt, generate Time Ordered Information (TOI), i.e. time series, for each scientific (SCI) and housekeeping (HK) parameter, archive the resulting TOI and subsequently ingest them into the Data Management Component (DMC) database. The Level 1 software has been designed and developed in order to support all phases of the Planck/LFI mission from the instrument ground tests (tuning and calibration) to the integration tests and the Flight operations. During the development process, from the Qualification Model (QM) of the software, where several ISDC components were reused, to the Flight Model (FM), critical design decisions were taken jointly with the DPC. The main questions were: a) Which data format do we choose: FITS or DMC? b) Which technology is more suitable to design and run the pipelines: do we use the Planck Process Coordinator (ProC), OPUS or simple Perl scripts ? c) Which components of the existing QM software need a refactoring or a complete redesign? d) Do we organize the data archive using a hierarchical directory structure or the FITS grouping? e) Do we reorganize and process the data stream into time slices or sequentially process the incoming telemetry packets? The timeline and available manpower are also important issues to be taken into account. We present here the orientation of our choices and discuss their pertinence based on the experience of the final pre-launch tests and the start of real Planck LFI operations.
|top|


AD Conversion Revisited in the Frequency Domain
Yoshihiro Chikada NAOJ
Analog-to-Digital conversion (ADC) is comprised of two steps. One is sampling and the other is quantization. A quantizer is a non-linear circuit which has stair case input-output characteristics. It is well-known that it creates noise whose power is 1/12 of the square of the step height provided that the step width is small enough compared to the input amplitude and that the quantizer has large enough number of steps to cover the input amplitude. Consider other example of a non-linear circuit such as a frequency conversion diode. In such frequency converters, if the setup is appropriate, we do not encounter noises which arise from the non-linearity. Where is the difference between an ADC and a frequency converter? Both have non-linearity whereas one produces noise and the other does not. Are there any ways to realize a noiseless ADC? The key is to think in the frequency domain. Non-linear circuit often produces harmonics and inter-modulated waves of the input wave. These are the noises, which can be filtered out with ′IF′ filter as in the frequency converters. We also discuss the possible roles of ′RF′ filter and ′LO′ for the ADC. In radio astronomy, to have bandwidth as wide as possible, ADCs with very small number of quantization levels (usually 2-8 levels) have been used. Therefore it is very important to develop means to minimize noises and/or spectrum deformation caused by an ADC. The Van Vleck correction or the quantization correction is known to correct the observed digitized correlation coefficient to the analog one. For an example, in a two level quantizer case, according to the correction the latter is proportional to arcsine of the former. The correction is conventionally understood via time domain joint probabilities between the digitized signals. We will show that this correction can also be reached analytically via frequency domain approach. According to the correction, there is a sudden rise in the correction curve when the observed correlation coefficient approaches to unity. Frequency domain approach shows that the rise is interpreted as the increase of correlation of higher order harmonics and inter-modulations. Implications derived from the frequency domain approach are discussed.
|top|


A Scalable On-Demand Crossmatch Engine
Tamas Budavari The Johns Hopkins University
We describe the design of a high-performance engine for cross-matching large astronomical catalogs. After a careful analysis of successes and failures of previous such services, we designed a new infrastructure that is inherently scalable to many concurrent queries and the largest jobs we face today. Speed improvements come from massive parallelization of the cross-match tasks on a cluster of database servers and optimized spatial indexing. The execution is driven by a workflow system that enables pausing and resuming or restarting the jobs, if needed. A novel probabilistic cross-identification algorithm is implemented that is based on Bayesian hypothesis testing (Budavari & Szalay 2008). We present its successful pilot applications on the SDSS, GALEX and Chandra catalogs, and detailed simulations with realistic variable errors. The system is designed to be flexible to include additional criteria of associations. Our new engine will from the core or the next-generation SkyQuery building on existing IVOA standards.
|top|


Photometric determination of quasar candidates
Ninan Sajeeth Philip St. Thomas College, Department of Physics
We describe an efficient and fast method for the detection and classification of quasars using a machine learning tool and photometric information from SDSS DR7 data release. The photometric information used are the nine independent colours that can be derived from the 5 filters available with SDSS and the machine learning algorithm used is a difference boosting neural network (DBNN) that uses Bayesian classification rule. The colour feature space of SDSS was divided into 4 subsets and the machine learning tool was trained on each subset independently. An adaptive learning algorithm was used to prepare the training sample for each region. Cross validations were done with SDSS spectroscopy and it was found that the method could detect quasars with above 90\% confidence regarding their true classification. The completeness at this stage was above 97\%. Contaminants were mainly stars and the failed quasars were from a few specific patches of redshifts. Color plots indicate that the colors of stars and quasars at those redshits were indistinguishable from each other and was the cause of their incorrect classifications. A confidence value (computed posterior Bayesian belief of the network) is assigned to every object that is classified. Almost all incorrect classifications have a low confidence value. This information can thus be used to filter out contaminants and thus improve the classification accuracy at the cost of reduced completeness.
|top|


Centroiding experiment for determining the positions of stars with high precision
Taihei Yano National Astronomical Observatory of Japan
Determination of the positions of star images on a detector with high precision is very important for astrometric technique that will be used for the observation of stars by a space astrometry satellite, such as JASMINE. JASMINE is the acronym of the Japan Astrometry Satellite Mission for INfrared Exploration, developed mainly at National Astronomical Observatory of Japan, and is planned to be launched around 2015. Aperture size of the telescope has a diameter of 30 cm. The main objective of JASMINE is to study the fundamental structure and evolution of the bulge components of the Milky Way Galaxy. In order to accomplish these objectives, JASMINE will measure annual parallaxes, positions and proper motions of stars during the observational program, with the precision of 10 microarcseconds. It is very important to ascertain by performing laboratory experiment that we can determine the positions of star images on the detector with high precision such as 10 microarcseconds. In order to determine centroid of star images, the central region of a star on the detector must be sampled by about a few pixels. In order to accomplish such a precision, we take the following two procedures. (1) We determine the positions of star images on the detector with the precision of about 0.01 pixel for one measurement, using an algorithm for estimating them from photon weighted means of the star images. (2) We determine the positions of star images with the precision of about 0.0001-0.00001 pixel, which corresponds to that of 10 microarcseconds, using a large amount of data over 10000 measurements, that is, the error of the positions decreases according to the amount of data. Here, we note that the procedure 2 is not accomplished when the systematic error in our data is not excluded adequately even if we use a large amount of data. We first show the method to determine the positions of star images on the detector using photon weighted means of star images. This algorithm, used in this experiment, is very useful because it is easy to calculate the photon weighted mean from the data. This is very important in treating a large amount of data. Furthermore, we need not assume the shape of the point spread function in deriving the centroid of star images. Second, we show the results in the laboratory experiment for precision of determining the positions of star images. We obtain that the precision of estimation of positions of star images on the detector is under a variance of 0.01 pixel for one measurement (procedure 1). We also obtain that the precision of the positions of star images becomes a variance of about 0.0001 pixel using about 10000 measurements (procedure 2).
|top|


A Case Study in Web 2.0 Application Development
Paul Marganian National Radio Astronomy Observatory, Green Bank
Recent web technologies focusing on languages, frameworks, and tools are discussed, using the Robert C. Byrd Green Bank Telescope′s (GBT) new Dynamic Scheduling System as the primary example. Within that example, we use a popular Python web framework, Django, to build the extensive web services for our users. We also use a second complimentary server, written in Haskell, to incorporate the core scheduling algorithms. We provide a desktop-quality experience across all the popular browsers for our users with the Google Web Toolkit and judicious use of JQuery in Django templates. Single sign-on and authentication throughout all NRAO web services is accomplished via the Central Authentication Service protocol, or CAS.
|top|


USING MULTIPARTITE GRAPHS FOR RECOMMENDATION AND DISCOVERY
Michael J. Kurtz Harvard-Smithsonian Center for Astrophysics
Modern information systems, such as the ADS, act as a nexus, linking together many densely interconnected systems of information. These systems can be viewed as systems of interacting graphs; an example of a bipartite graph would be the interaction of the set of all papers with the set of all authors which yields connections between papers and papers (papers are connected if they have the same author) and between authors and authors (co-authorship). Modern computational techniques permit these rich data sources to be used to solve practical problems. Some techniques use the graph representation to achieve orderings, such as the Girvan-Newman 2002PNAS...99.7821G or Rosvall-Bergstrom 2008PNAS..105.1118R algorithms, or by eigenvector techniques on the interconnectivity or influence matrices, either using exact methods , e.g. Kurtz 1993ASSL..182...21K or approximate methods suitable for huge systems like PageRank http://ilpubs.stanford.edu:8090/422/ Developing practical solutions to the problem: ″given my current state of knowledge, and what I am currently trying to do, what would be the best things for me to read?″ requires an in depth understanding of the properties of the data and the nature of the many different reduction techniques. The data is quite complex; as an example two papers (A and B) can be connected to each other because 1) A cites B; 2) B cites A; 3) A and B cite C; 4) author X wrote both A and B; 5) author X wrote a set of papers, at least one of which was cited by A and B; 7) A and B were read by the same person;8) A and B have the same key word; 9) A and B refer to the same astronomical object; 10) etc. A practical example of combining data and techniques to build a faceted browse system for current awareness would be: take a set of qualified readers, say persons who read between 30 and 100 papers in the main astronomy journals in the last three months; for each reader find the papers that reader read; for each of these papers find the papers that paper reference; for each of these papers find the keywords assigned to that paper by the journal; for each reader create a N dimensional normalized interest vector, where each dimension is a keyword and the amplitude represents the normalized frequency of occurrence in the papers cited by the papers read. This yields a reader-keyword matrix, one way to view this is that the readers are points in a multidimensional keyword space. Several things can be done with this matrix, for example if the readers are clustered, by K-means or some other algorithm, one obtains groups of readers with similar interests. These can be used as the basis of a collaborative filter, to find important recent literature of interest, and can also be subdivided, to narrow the subject (as defined by people with similar interests). This creates a faceted browse of important recent papers in subjects of current interest. The ADS has sufficient numbers of users to support three levels of facets.
|top|


'SAMP'ling your browser for the Semantic Web
Sebastien Derriere CDS, Observatoire de Strasbourg
SAMP, the Simple Application Messaging Protocol, is one of the successes of the Virtual Observatory (VO). By allowing communication between various applications, it enables easy data sharing, and facilitates data exploration, taking advantage of each application′s functionalities. SAMP can also be used to allow web browsers to interact with the VO. We will show for instance how Firefox can be complemented with a plugin allowing the user to send messages from any web page to existing VO applications. But there is more to be done in the context of the Semantic Web. Semantic annotations can be included in web pages using microformats or RDFa (Resource Description Framework in attributes). We will demonstrate how to take advantage of this semantic markup using SAMP. Annotated web pages can be consumed by a browser plugin to build dedicated SAMP contextual messages (e.g. pointing an application to sky coordinates present in the web page). This mechanism provides a generic yet powerful way to interact between, for example, an astronomical web portal and other VO tools.
|top|


Data Visualisation, Statistics and Machine Learning
Ajit Keshav Kembhavi Inter-University Centre for Astronomy and Astrophysics
Vast quantities of astronomical data can now be accessed through data archives and other sources. The data can be in highly processed form, presented as ready-to-use tables. Data on the same set of objects can be available over a wide range of wavelengths, which facilitates multiwavelength studies. The focus has therefore shifted from processing of raw data and images using a variety of techniques, to the scientific analysis of the processed data products. The data to be analyzed may involve only a few to several tens of objects, which have to be subjected to statistical studies, aided by advanced visualization. Or the data could be vast, perhaps even be spread over archives in more than one location, making it impractical to get it to the user′s end for analysis. These and other situations call for appropriate tools for visualization and sifting of the data, for advanced statistical analysis, and also for machine learning tools which can be applied in certain situations. Several sophisticated but easy to use tools for such analysis have been developed in recent years in the framework of Virtual Observatories. I will review in my talk some general aspects of astronomical data visualization and statistics, describe some of the important tools developed by different Virtual Observatory programmes, and illustrate their use with applications to some astronomical problems.
|top|


Another way to explore the sky: HEALPix usage in Aladin full sky mode
Pierre Fernique Strasbourg Observatory, CDS
The last few years have seen the emergence of a new feature in several astronomical visualization tools : the interactive sky browser supporting immediate panning and zooming. World Wind, Google Sky, World Wide Telescope, Wikisky, Virgo and now Aladin, all these tools have in common a view of the sky based on a hierarchical multi-resolution sky tessellation. The aim is to load and draw the good ″pieces″ of the sky at the good resolution as fast as possible, according to the current user sky view. The goal is the same but sky indexing solutions differ significantly and do not offer the same capabilities in term of performances, underlying data base complexity, available projections, projection distortion, pixel value access, graphical overlays, etc. Actually, most of the tools offer false-colour skies with a unique simple projection. But this new feature can be used not only for providing a sky background, but also for accessing and analyzing pixel data in the same way that astronomers commonly use FITS images for doing science. In this talk, we will present how Aladin is using an HEALPix sky tessellation for building a powerful sky data base. We will present the arguments in favor of HEALPix, notably: - The intrinsic qualities of HEALPix for implementing fast pixel algorithms such as convolutions, Fourier analysis, wavelet decomposition, nearest neighbor searches, topological analyses... - The hierarchical structure of the sky directly mapped in a simple directory tree, allowing immediate usage for local data; - The projection methods for reducing as much as possible the distortions notably at poles and at the ″sky borders″; - The available libraries, and especially the Java package supporting deep sky resolution; - Last but not least, the direct usage for current mission data such as Planck; - etc. We will also discuss about the compatibility/interoperability between all these tools and how we could avoid to duplicate these data bases and implement efficient collaboration. This might open the door to a future VO standard describing this new way to explore the sky.
|top|


Visualization-directed interactive model fitting to spectral data cubes
Christopher Jon Fluke Swinburne University of Technology, Centre for Astrophysics & Supercomputing
Spectral datasets from radiotelescopes and integral field units are increasing in complexity as new facilities and instruments come on line. With greater velocity resolution comes an increasing need to visualize and quantitatively analyse the velocity structures. As the visible structure in spectral datacubes is not purely spatial, additional insight is required to relate structures in 2D space plus line-of-sight velocity to their three-dimensional sources. This can be achieved through the use of simulations that are converted to velocity-space representations. We have used the S2PLOT programming library to enable intuitive, interactive comparison between 3D spectral data and models, with potential for improved understanding of the spatial configurations. We also report on our use of 3D shapelet decomposition to enable quantitative analysis of velocity structures from radiotelescope and integral field unit data. These approaches can be extended to studies in the time domain, by stacking sky images to form data cubes.
|top|


Different Displays for Different Brains: How Neurology of Vision Effects Data Interpretation
Matt Schneps CfA
When creating displays of scientific data an assumption is often made that all people perceive graphical data displayed on a screen in the same way. A complex chain of neurology mediates vision, and individual differences in neurology can alter how an individual perceives and interprets the data displayed. For example, there is evidence that dyslexia (a hereditary neurological condition associated with slowness in reading and/or difficulties with spelling) introduces a bias in visual perception favoring information in the visual periphery over that in the center. While this difference in neurology is predicted to make some tasks such as a search for detail hidden in an image more difficult, this neurology should facilitate performance on tasks that call for the integration of global information across a scene. We tested this hypothesis using a task designed to simulate the double-peaked graphical signature of radio spectra associated with black holes. We predicted that scientists with dyslexia would have an advantage in this black hole detection task. We investigated this hypothesis in a study of professional astrophysicists, and found in our preliminary analysis that the scientists with dyslexia are indeed, as predicted, better at identifying the simulated black holes when compared to their colleagues without dyslexia (b = -0.285, SE = 0.09, p <0.05). These findings illustrate how decisions made in the design of a graphical presentation can interact with an individual′s neurology to alter the scientific utility of the display. An understanding of how the neurology of vision varies among individuals can thus be used to inform the more effective display of scientific data. (Research supported by funds from the National Science Foundation, HRD-0726032.)
|top|


Cognitive imaging in visual data-driven decision-support systems
Vladimir L. Gorohov ENGECON State University
Within data-driven types of decision-support systems (DSS, DDDSS), visual decision-support systems are those that try to inspire operator to find solution (decision) by producing visual representation of the data. Traditional approaches, that utilize traditional scientific visualization techniques such as 2D and 3D plots, vector fields, surface maps etc, works well when subject to represent is relatively simply structured data, low-dimensioned and weak interconnected. However, modern scientific experiments, as those in astrophysics observations, generate huge volumes of multidimensional complicated data. More sophisticated approach for visualizing of big volumes of multidimensional data is that based on the cognitive machine graphics techniques, which, for example, are used in visualization system Space Walker (SW). In contrast to illustrative ones, the cognitive images are aimed to make clear and evident some difficult scientific concepts and promote us with a new knowledge. Three particular ideas form the subject of our research; first utilizing of non-parametrical statistics for data preparation and dynamical plane projection visualization method. These ensure that data visualization is not influenced by some model, what respectively gives possibility to use this approach in case of deep a priory uncertainty. Moreover, it allows simultaneous visualization of multidimensional data, what helps researcher to look into problem in large. Second connecting of descriptive imagination, intuition and experience through visualization of data via entertaining and aesthetically attractive images causes activation of intuitive descriptive thinking what in turn inspires operator for creative scientific ideas and nontrivial solutions. Finally compiling philosophical ideas from Husserl′s phenomenology we worked out particular algorithms for operator, which can rule him during his investigation, armed with cognitive visualization system. By combination of three described approaches, we achieve a new class of so called technognostic systems, which can effectively assist in solving scientific problems by intuition stimulation and inspiration. Several applications of algorithm with examples based on Space Walker software describe how cognitive graphics can help researcher to find out peculiarities and patterns in common catalogues of astrophysical observations. To sum up there is a list of potential advantages of cognitive DDDS systems compared to traditional DS systems: - Huge volumes of multidimensional data can be presented simultaneously - The operator when dealing with cognitive image is not influenced by outer models, what in turn allow to use systems in case of a deep a priory uncertainty - Existing data sets and archives can be used - Aesthetically attractive images and ability to operate on them like in 3D space allow researcher to utilize his knowledge in connection with boosted descriptive imagination - This phenomena in turn can inspire intuition for non-trivial decision and solutions The main goals of the paper are to describe the multidisciplinary approach we used in while working on the methodology of cognitive visualization and to show advantages and disadvantages of such system, and some possible future applications for them.
|top|


WorldWide Telescope: A system of components enabling institutions to create rich web based data access and visualization tools.
Jonathan E Fay Microsoft Research
WorldWide Telescope has grown from a standalone visualization platform to a rich set of components that can utilized by portals, data providers or research projects to allow rich data access to both catalog and image data. The WWT Client also provides SAMP enabled interoperability allow a suite of data services across client, web and server.
|top|


The Virtual Observatory: Retrospective and Prospectus
Robert Hanisch Space Telescope Science Institute
At the ADASS XV in San Lorenzo de El Escorial, Spain, in October 2005, I gave an overview of the accomplishments of the Virtual Observatory initiatives and discussed the imminent transition from development to operations. As I prepare this abstract, that transition remains on the horizon for the US Virtual Observatory, and VO projects worldwide have encountered various programmatic challenges. The successes of the Virtual Observatory are many, but thus far are primarily of a technical nature. We have developed a data discovery and data access infrastructure that has been taken up by data centers and observatories around the world. We have web-based interfaces, downloadable toolkits and applications, a security and restricted access capability, standard vocabularies, a sophisticated messaging and alert system for transient events, and the ability for applications to exchange messages and work together seamlessly. This has been accomplished through a strong collaboration between astronomers and information technology specialists. We have been less successful engaging the astronomical researcher. Relatively few papers have been published based on VO-enabled research, and many astronomers remain unfamiliar with the capabilities of the VO despite active training and tutorial programs hosted by several of the major VO projects. As we (finally!) enter the operational phase of the VO, we need to focus on areas that have contributed to the limited take-up of the VO amongst active scientists, such as ease of use, reliability, and consistency. We need to routinely test VO services for aliveness and adherence to standards, working with data providers to fix errors and otherwise removing non-compliant services from those seen by end-users. Technical developments will need to be motivated and prioritized based on scientific utility. We need to continue to embrace new technology and employ it in a context that focuses on research productivity.
|top|


VAMDC: The Virtual Atomic and Molecular Data Centre
Nicholas Walton Institute of Astronomy, University of Cambridge
There are many academic research groups playing a central role in the production of a vast range of atomic and molecular (AM) data, data that is of critical importance across a wide range of applications such as astrophysics, atmospheric physics, fusion, environmental sciences, combustion chemistry and in industrial applications from plasmas to lighting. Currently these vital and fundamental A&M resources are highly fragmented, available through a variety of interfaces, thus limiting the full exploitation of their scientific worth. This impacts negatively on research programmes across a wide range of topics from space exploration (the search for extra solar planets, understanding the chemistry of our local solar system, of the wider Universe), the study of the earths atmosphere, climate change, fusion programmes, and so forth. The Virtual Atomic and Molecular Data Centre (VAMDC) (see http://www.vamdc.eu) is a major new EU FP7 supported project which will create a secure, documented, flexible and interoperable e-science environment-based interface to existing Atomic and Molecular (AM) data. It will be built upon the expertise of existing AM data producers and service providers with the aim of creating an infrastructure that is easily tuned to the requirements of a wide variety of users in academic, governmental, industrial or public communities. VAMDC will be enabled by the utilisation of the excellent grid and Virtual Observatory (VO) data and application infrastructure that has been created across Europe by initiatives such as the Euro-VO (http://www.euro-vo.org) and EGI (http://web.eu-egi.eu/). We will provide a brief overview of the project, aims and key objectives: to implement the VAMDC interface for accessing major existing databases containing heterogeneous data and aimed at different users; enable data queries across multiple databases that are focussed on specific research topic(s); enable data publishing/quality control process for major A&M data producers; involve wide user and producer communities in development and use of VAMDC We describe the key infrastructure that will be created during the project lifetime, in particular we note the possible use of emerging VO standards in exposing AM data and resources, where extensions to these standards are required, and the challenges involved in bridging the demands of astronomy users with those of other domains. We outline the initial baseline VAMDC service infrastructure plan and use of relevant VO infrastructure developed in the context of the Euro-VO. The VAMDC consortium is led by CNRS, France (LPMAA, Universite Paris 6; Observatoire de Paris; Observatoire de Bordeaux; Observatoire de Grenoble; Institut Carnot de Bourgogne; GSMA, Universite de Reims; CESR, Toulouse ), and includes the University of Cambridge, University College London, Open University, Queen′s University Belfast, UK; Universitaet Wien, Austria; Uppsala Universitet, Sweden; Universitaet zu Koeln, Germany; Osservatorio Astronomico di Cagliari-INAF, Italy; Astronomska Opservatorija, Serbia; Institute for Spectroscopy RAS, Russian Federal Nuclear Centre All-Russian Institute of Technical Physics, Institute of Atmospheric Optics, Institute of Astronomy of the Russian Academy of Sciences; Corporacion Parque Tecnologico de Merida, Venezuela. VAMDC commenced in July 2009 and runs until the end of 2012.
|top|


A VO-driven National Astronomical Data Grid in China
Chenzhou CUI National Astronomical Observatory of China
In the next few years, there will be much change in the observational astronomy field in China. LAMOST telescope is stepping into commission period; Antarctic observatory at Doom A will be put into operation; many existing instruments will be improved. We begin to face large datasets from various observation projects. Furthermore, more and more simulation data is accumulated. Starting from LAMOST spectrum archives, Qinghai 13.7m radio telescope archive and Shanghai simulation datasets, China-VO project is planning a VO-driven national astronomical data grid environment. The main aim is providing basic catalog-level and file-level data access functions. Several VO related modelers, for example, iRODS, VOSpace, TAP, and Registry are considered to integrate into the platform. Latest progress from the LAMOST project, brief information about some other projects in China, our initial plan for the national data grid platform will be introduced in my talk.
|top|


Transparent scientific usage as the key to success of the VO
Igor V. Chilingarian Observatoire de Paris, LERMA

Nowadays, following years of technological development, Virtual Observatory standards, resources, and services became powerful enough to help astronomers making real science on everyday basis. The key to the VO success is its entire transparency for a scientific user. This allows an astronomer to combine ``online′′ VO-enabled parts with ``offline′′ research stages including dedicated data processing and analysis, observations, numerical simulations; and helps to overpass one of the major issues that most present-day VO studies do not go further than data mining. Here I will present three VO-science projects combining VO and non-VO blocks, all of them resulted in peer-reviewed publications submitted to major astronomical journals.

(1) We have used a VO-fed workflow to automatically analyse a large amount of HST data and discovered a population of compact elliptical (M32-like) galaxies in nearby clusters. Some of these galaxies were later observed with the 6-m telescope to confirm their membership in the clusters, some others were confirmed by analysing archival spectra also available in the VO. We have performed dedicated numerical simulations to model their origin by the tidal stripping, demonstrating the importance of this galaxy evolution mechanism.

(2) We have cross-identified three large sources of photometric data: GALEX GR4 (UV), SDSS DR7 (optical), UKIDSS DR5 (NIR) and compiled a homogeneous FUV-to-NIR catalogue of spectral energy distributions of nearby galaxies (0.03<z<0.6). We have extracted the data for the spectroscopically confirmed galaxies and fitted their SDSS DR7 spectra to obtain stellar population parameters, velocity dispersion and residual emission line fluxes of some 190000 galaxies. By using VO tools and technologies, all the computational part of the study was completed in a week after the UKIDSS Data Release 5.

(3) The GalMer database is a part of the Horizon project, providing access to a library of TreeSPH simulations of galaxy interactions. We have developed a set of value-added tools related for data visualization and post-processing with available VO-interfaces, including the spectrophotometric modelling of galaxy properties, making GalMer the most advanced resource providing online access to the results of numerical simulations. These tools allow direct comparison of simulations with imaging and spectroscopic observations.

Presentation of these three examples aim at stimulating usual astronomers to carry out VO-enabled research on everyday basis. Although minor infrastructural difficulties still exist, VO-enabled research beyond data mining is already possible. We foresee a growing amount of VO-powered studies to arrive in near future.

|top|


Lessons Learned during the Development and Operation of Virtual Observatory
Masatoshi Ohishi National Astronomical Observatory of Japan
In the last a few years several Virtual Observatory (VO) projects have entered from the research and development phase to the operations phase. The VO projects include AstroGrid2 (UK), Virtual Astronomical Observatory (former National Virtual Observatory, USA), EURO-VO (EU), Japanese Virtual Observatory (Japan), and so on. These successful transitions from the develpment phase to the operations phase owes primarily to the concerted action to develop standard interfaces among the VO projects in the world, that has been conducted in the International Virtual Observatory Alliance. The registry interface has been one of the most important key to share among the VO projects and data centers (data providers) with the observed data and the catalog data. Data access protocols and/or language (SIAP, SSAP, ADQL) and the common data format (VOTable) are other keys. Consequently we are able to find scientific papers so far published (see, e.g., the IVOA Newsletter, Issue No.2, http://www.ivoa.net/newsletter/002/). However, we had faced some experience during the implementaion process as follows: 1) At the initial stage of the registry implementation, some fraction of the registry meta data were not correctly set, or some meta data were missing. IVOA members found that it would be needed to have validation tools to check the compliance before making the interface public; 2) It seemed that some data centers and/or data providers might find some difficulties to implement various standardized interfaces (protocols) in order to publish their data through the VO interfaces. If there were some kind of VO interface toolkits, it would be much ieasier for the data centers to implement the VO interfaces; 3) At the current VO standardization, it has not been discussed in depth on the quality assurance on the published data, or how we could provide indice on the data quality. Such measures would be quite helpful for the data users in order to judge the data quality. It would be needed to discuss this issue not only within IVOA but with observatories and data providers; 4) Past and current development in the VO projects have been drived from the technology side. However, since the ultimate purpose of the VOs is to accerelate getting astronomical insights from, e.g., huge amount of data or multi-wavelength data, science driven advertisement (including schools to train astronomers) would be needed; 5) Some data centers and data providers mentioned that they need to be credited. In the Data-Centric science era it would be crucial to explicitly respect the observatories, data centers and data providers; 6) And others. I would like to discuss the above issues in my talk.
|top|


Theoretical Virtual Observatory services at VO-Paris Datacentre
Franck Le Petit LUTH - Paris Observatory
If important efforts have been realized to develop standards and publish observational data through the Virtual Observatory, significant efforts are also done to publish and develop theoretical VO services. Indeed, a scientific return of large observational facilities will only be possible if the community has access to state of the art simulation codes and simulation results. Several teams of VO-Paris Datacentre develop VO theoretical services and participate to the definition of VO-Theory standards. In this talk, I will present some of our services. First, I will present the Meudon PDR code services. The Meudon PDR code is a public code computing the structure of interstellar neutral clouds. It solves in a consistent way the radiative transfer from UV to sub millimeter, the chemistry and the thermal balance. This code has been used to interpret observations of diffuse clouds (FUSE and HST/STIS observations), PDRs (ISO, VLT observations) and dark clouds (ex: IRAM observations), etc. It will be used to interpret HERSCHEL observations for several key programs. To facilitate the use of the code, we developed two kind of services: an online version of the code integrated in Astrogrid with computing resources on demand and a PDR VO-Theory database to facilitate the interpretation and the preparation of the observations of the next generation of instruments as HERSCHEL and ALMA. I this first part, I will present the services and how the Virtual Observatory facilitated the development of these services. Then, I will present the STARFORMAT project, funded by Astronet. I will focus on the dense cores simulations VO-database that will provide to the community state of the art MHD simulation results and properties of dense cores (density, velocity, magnetic field profiles,). These projects, PDR and STARFORMAT, will lead to the development of a platform of theoretical services to interpret observations in the Interstellar Medium. I will then finished, presenting the Dark Energy Universe Database developed at LUTH - Paris Observatory. This project aims at providing large-scale cosmological simulations with different cosmological scenarios.
|top|


Status of GDL - GNU Data Language
Alain Coulais LERMA, CNRS
Gnu Data Language (GDL) is an open-source interpreted language aimed at numerical data analysis and visualisation. It is a free implementation (under GNU GPL licence) of the Interactive Data Language (IDL) widely used in Astronomy. GDL has a full syntax compatibility with IDL, and includes a set of more than 350 library routines targeting advanced matrix manipulation, plotting, time-series and image analysis, mapping, and data input/output including numerous scientific data formats. We will present the current status of the project, the key accomplishments, and the weaknesses - areas where contributions are welcome! GDL is written in C++, the library routines make use of numerous open-source libraries including: the GNU Scientific Library (GSL), the Plplot plotting library, FFTW Fourier transform package. Data input/output is managed using ImageMagick, NetCDF, HDF and HDF5 libraries. Large part of Astron Library is working well in GDL, including the FITS part. XDR files can be read and write. GDL features a Python bridge (Python code can be called from GDL, GDL can be compiled as a Python module). Packaged versions of GDL are available for several platforms including Max OS X, Debian and Ubuntu, Fedora and Red Hat, Gentoo and *BSD. The source code compiles on most Linux distributions and other UNIX systems (e.g. OpenSolaris). The core components of GDL (i.e. interpreter, library routines API, key data manipulation and plotting functionality) are stable and do not pose efficiency problems (no significant discrepancy from IDL performance). GDL still lacks the IDL widget functionality for GUI-development, but partial support should appear soon. We hope to consolidate the users community, to gather feedback in form of bug reports, feature requests, test routines, documentation and patches (several GDL modules have been provided by scientists who wrote the functions for their own work).
|top|